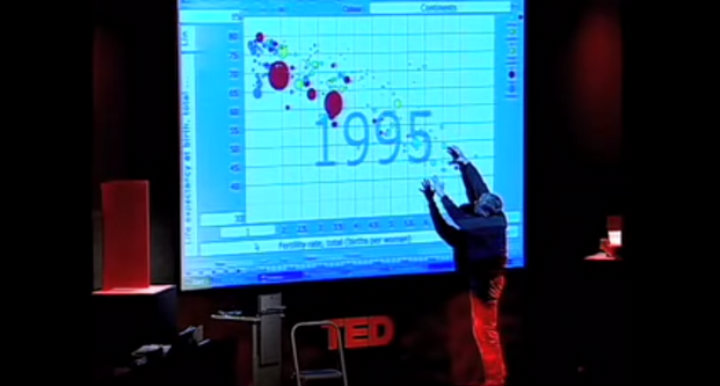
In his 2006 TED talk, Hans Rosling used data visualizations to deconstruct his students’ assumptions about the ‘developed’ and ‘developing’ dichotomy of countries. He looked at the patterns and demonstrated how they were easily recognizable and showed something contrary to the original belief. Pattern recognition is the core power of data visualization and more companies are embracing the notion of “putting humans back in the decision making process”.
Good data visualizations make patterns and outliers easy to recognize and aesthetically pleasing. The data are “liberated” from numbers and letters into a form that can be easily analyzed and understood by everyone.
Read the full article >

